Wednesday, November 19, 2014

Analog and Digital Electronics, Lighting an LED, Building an Amplifier to Boost Current from an Audio Player

Analog and Digital Electronics

A cell phone was connected to a speaker which was all connected to the oscilloscope.  A tone generator app was downloaded on the phone and different tones were shown across the oscilloscope.  The max voltage the phone will put out through an audio jack was found using the oscilloscope and it can be seen that as the frequency increases, the voltage decreases (see whiteboard)
As frequency increases voltage decreases

Max Voltage Produced by Phone


A song was also played on the oscilloscope and the different voltages the music produces is shown across the screen.
Jack Johnson on an Oscilloscope

-adding a capacitor to the circuit with the speaker


Capacitors are frequency dependent so when you add a capacitor to the circuit with the phone and the speaker, the capacitor acts as a low pass filter so it passes low frequencies and blocks or gets rid of high frequencies which are high pitched.


Lighting an LED

A circuit was made with a protoboard, a 150 ohm resistor, and a led light bulb.  The light bulb is a diode so when you put power into the led light backwards, it does not light because you are making the depletion zone bigger.  The led light bulb also needs a minimum amount of voltage to light the bulb because you need that minimum voltage to close the depletion zone.


  A switch was then added to the circuit so you could turn on and off the light bulb.  

lighting LED with switch


Building an Amplifier to Boost Current from an Audio Player

An amplifier was made to make the noise coming from the cell phone louder than the max voltage 
the phone can produce.  


Tuesday, November 18, 2014

Horizontal Deflection, Sounds from a Function Generator & Oscilloscope Controls, Measuring Changing Voltage, Task, Mystery Box

Horizontal Deflection


The oscilloscope applies sinusoidal wave to horizontal deflection plate so that dot moves in a horizontal circle on the screen


Sounds from a Function Generator & Oscilloscope Controls

A speaker was attached to a function generator and produced sounds at different frequencies.  (See whiteboard for lab activity answers)
Frequency generator and speaker set up

The function generator was then connected to the oscilloscope and the sound waves were displayed across the screen.
Battery Connection (part d on Oscilloscope Controls Lab)

Answers to Sounds from a function generator and oscilloscope controls lab

Measuring Changing Voltage

A function generation was at to produce a 96-Hz sinusoidal wave form and the image was measured with the oscilloscope.  (See whiteboard/pictures and videos for lab activity answers)
Oscilloscope producing sine wave at .096kHz

Oscilloscope producing wave on square function at .096 kHz
Answers to Measuring Changing Voltage Lab

Task

1)  A small DC wallward was connected to the oscilloscope and the characteristics were judged.  Next an AC transformer was connected to the oscilloscope and the output was measured.  (See pictures for lab activity)
2)  Lissajous Figures: A small AC transformer was connected to Ch 1 of the oscilloscope and the function generatior was connected to Ch 2 of the oscilloscope.  The frequence on the function generatior was set to frequency 30hz and Ch 1 and Ch 2 were turned on and xy mode was selected so the oscilloscope would display Ch 1 on the x axis and Ch 2 on the y axis.  When 30 Hz was on the oscilloscope showed a y^2 graph because the frequency of the function generator was less than the frequency of the AC transformer.  When the frequency of the frequency generator was set to 60 Hz the oscilloscope showed a circle because the grequency of the function generator and the frequency of the AC transformer were running at the same frequency.  When the frequency generator was set to 120 Hz the oscilloscope dsplayed a –x^2 graph because the frequency of the function generator was twice the frequency of the AC transformer.
DC walwart

AC Transmitter 

Answers to Task Lab

Answers to Task Lab


Mystery Box

A mystery box with several terminals was given to us and we found which terminal produced what my making measurements with the oscilloscope.  The voltages add up across the board so it runs DC except for the first hole to the last hole, they should have the greatest voltage, but the box must have been left on and the battery drained which caused for error in data. 
Answers to Mystery Box Lab


Capacitors in Series and Parallel, Charge Buildup and Decay in Capacitors, A Capacitance Puzzle, Quantitative Measurements on an RC System

Capacitors in Parallel
Capacitors in Series and Parallel
capacitors in series


Two capacitors of the same capacitance ( .1E-06 F) were connected first in parallel and then in series.  When the capacitors were hooked up in parallel with alligator clips, a multimeter was used to measure the capacitance which was 1.945E-06 F while the capacitance hooked up in series was measured with the multimemter to be only .482E-06 F.  The relationships can be seen between capacitors connected in series and in parallel (see whiteboard)


Charge Buildup and Decay in Capacitors


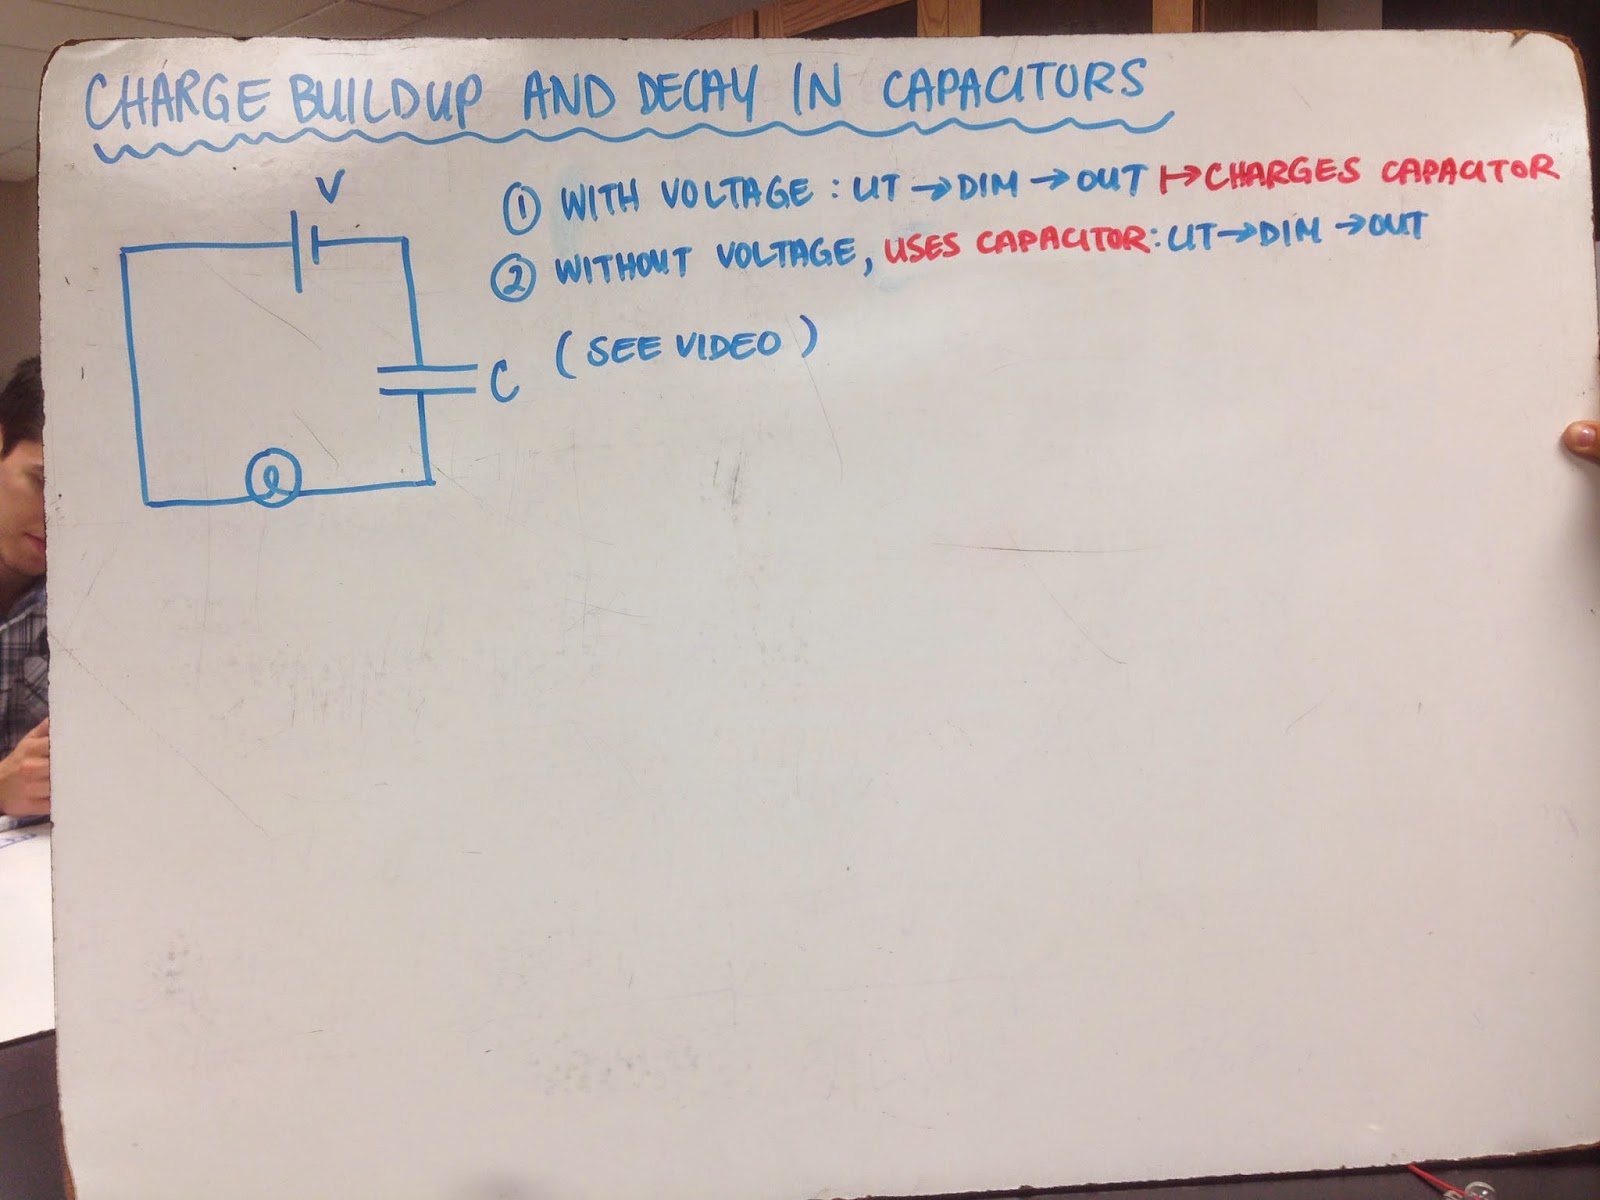
A capacitor, a source of voltage, and a light bulb were all connected in series.  First the light bulb was lit and then as the capacitor was charged the light bulb dimmer and dimmer until it turned off.  Then the connections were taken out of the voltage source and touched to one another to create another series circuit but without the voltage source.  The light bulb lit up and the went dimmer and dimmer until it went out.  The light bulb was able to light up without the voltage source because the capacitor was charged with energy.


A Capacitance Puzzle


Two separate capacitors each of charge .47 F were each connected to a voltage source one with voltage 3.0 V and the other with voltage 4.5V.  Then the capacitors were unhooked from their batteries and hooked to eachother without being discharged.  We predicted that the voltage across the two would end up being an average of the two voltages.  A system of equations were used to solve this problem and we know that when there is no discharge that the final sum of the charges on the two capacitors is actually the average sum (like an equilibrium point).  We solved for the voltage in the final set up where the capacitors were connected to one another and solved the value to be 3.74.  We then measure the actual voltage between the two capacitors with a multimeter which was found to be 3.94 and found that there was a 5.8 % error between the two numbers probably due to the fact that the capacitors we used when measuring the voltage with the multimeter were .56 F not .47 F.


Quantitative Measurements on an RC System


set up
First we measured the voltage across a charged capacitor as a function of time when a carbon resistor has been placed ina circuit with it.  With the voltage source connected, the graph rises and the levels off and then when the voltage source is disconnected the voltage begins to drop.  (These graphs can be seen on whiteboard) We fit an equation for these graphs and found that they are slightly different for when the voltage source is connected (charging) and when the voltage source is disconnected (discharging).  For the charging capacitor, the voltage equation is A(1-e^(-cb)) and for the discharging capacitor the voltage equation is Ae^(-cb).   After doing unit analysis, it can be seen that A is the max voltage, and cb is equal to t/RC.  Using the data from the graphs, the experimental value for t/RC was -.3620 for the charging capacitor and .3571 for the discharging capacitor.  We calculated the actual value for t/RC with the equipment we used and found it to be .4.  We found that there was a 9.97 and 11.3 % error respectively.


graphs


Thursday, November 6, 2014

Blowing up a Capacitor, Creating a Capacitor

Blowing up a Capacitor

When you connect a capacitor you should always make sure to connect the positive side to the positive side and the negative side to the negative side.  If you do not do this then the capacitor will BLOW UP!!!!!!!!!


Creating a Capacitor


Two identical sheets of aluminum foil were cut and placed in between a piece of paper in a book.  We connected a multimeter to the sheets of aluminum and measured the value of the capacitance.  We increased the number of papers between the aluminum foil and measured the values of the capacitance.  After finding the capacitance we solved for the K (dielectric) value and saw that as we increased the distance between the pieces of aluminum, we increased the dielectric values.  


Connections in Series and Parallel, Using a Multimeter, Decoding and Measuring Resistors

Connections in Series and Parallel


First example with switch open
In the first example in the picture below when the switch is closed we predicted that all three of the light bulbs would be the same brightness so therefore light bulbs one and two would get dimmer than before and the third light bulb would turn on, but the answer was that nothing happened and light bulb three didn’t turn on because the potential difference between each side of the bulb was zero.  

First example with switch closed


second example with switch open
For the second example when the switch was closed we predicted that both of the light bulbs would get dimmer because of the direction of the flow due to the position of the battery in the circuit, but the answer was that nothing happened and the bulbs stayed the same brightness because the potential difference between each side of the battery was the same making the potential difference 0.  


pictures drawn of examples 1 & 2 and predictions/answers


Using a Multimeter

Series

A circuit was set up in series with two bulbs and two batteries.  Using a multimeter the current and voltage were measured.  After taking measurements it can be seen that in a series circuit the current is the same across the wires bulbs and batteries and that the voltage across the light bulbs adds up to be the voltage across the batteries. 


Parallel

We preformed the same task as in the series circuit for the parallel circuit and measure the current and voltage in the parallel circuit.  After making all the measurements it can be seen that this is the exact opposite of the series circuit.  The voltages are the same everywhere and the currents add up across the bulbs to equal the total current. 


Decoding and Measuring Resistors


Resistors have a code that measures the resistance throughout the resistor.  The equation is AB x 10 ^ C.  We were gives three resistors and found the resistance value that they should be giving.  We tested one of the resistors strength by measuring its resistance with a multimeter.  For that specific resistor we calculated 100 +/- 5 ohms and when we measured it with the multimeter, we got a value of 97 ohms which falls within the uncertainty range of the resistor meaning that this is a reliable resistor/manufacturer.